Press kit · October 2026
A century of New Yorkers, mapped dot by dot
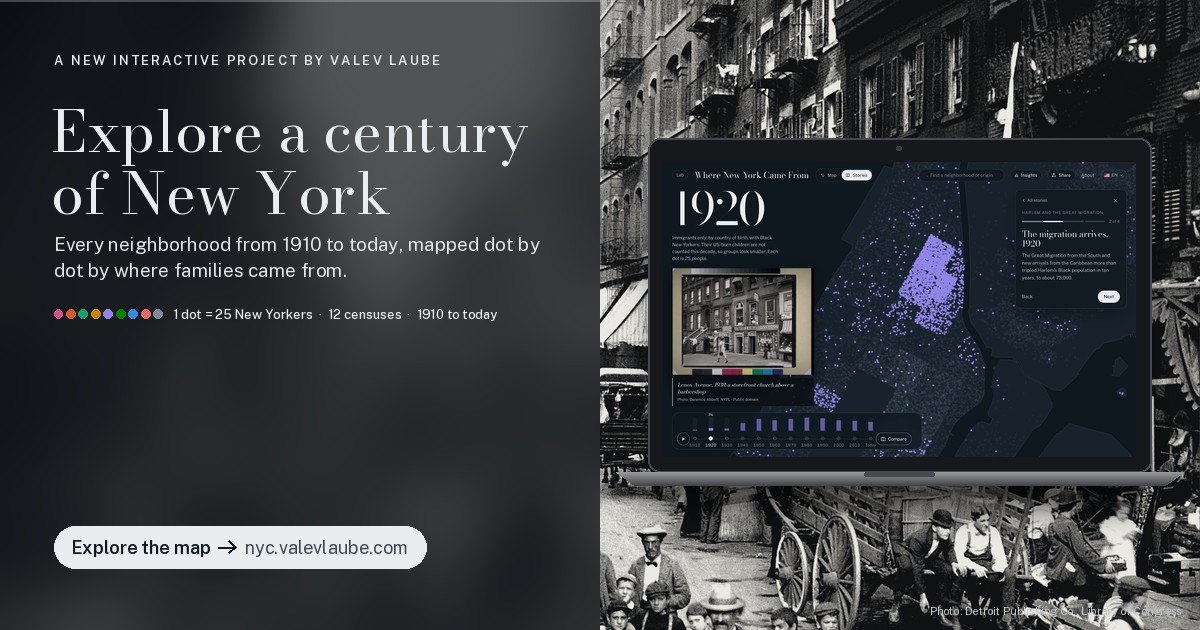
Where New York Came From is a free interactive map of every New York City neighborhood from 1910 to today. Each dot stands for 25 people, colored by where their families came from, across twelve censuses.
Key facts
The release
For immediate release
New interactive map shows where every New York neighborhood came from, census by census since 1910
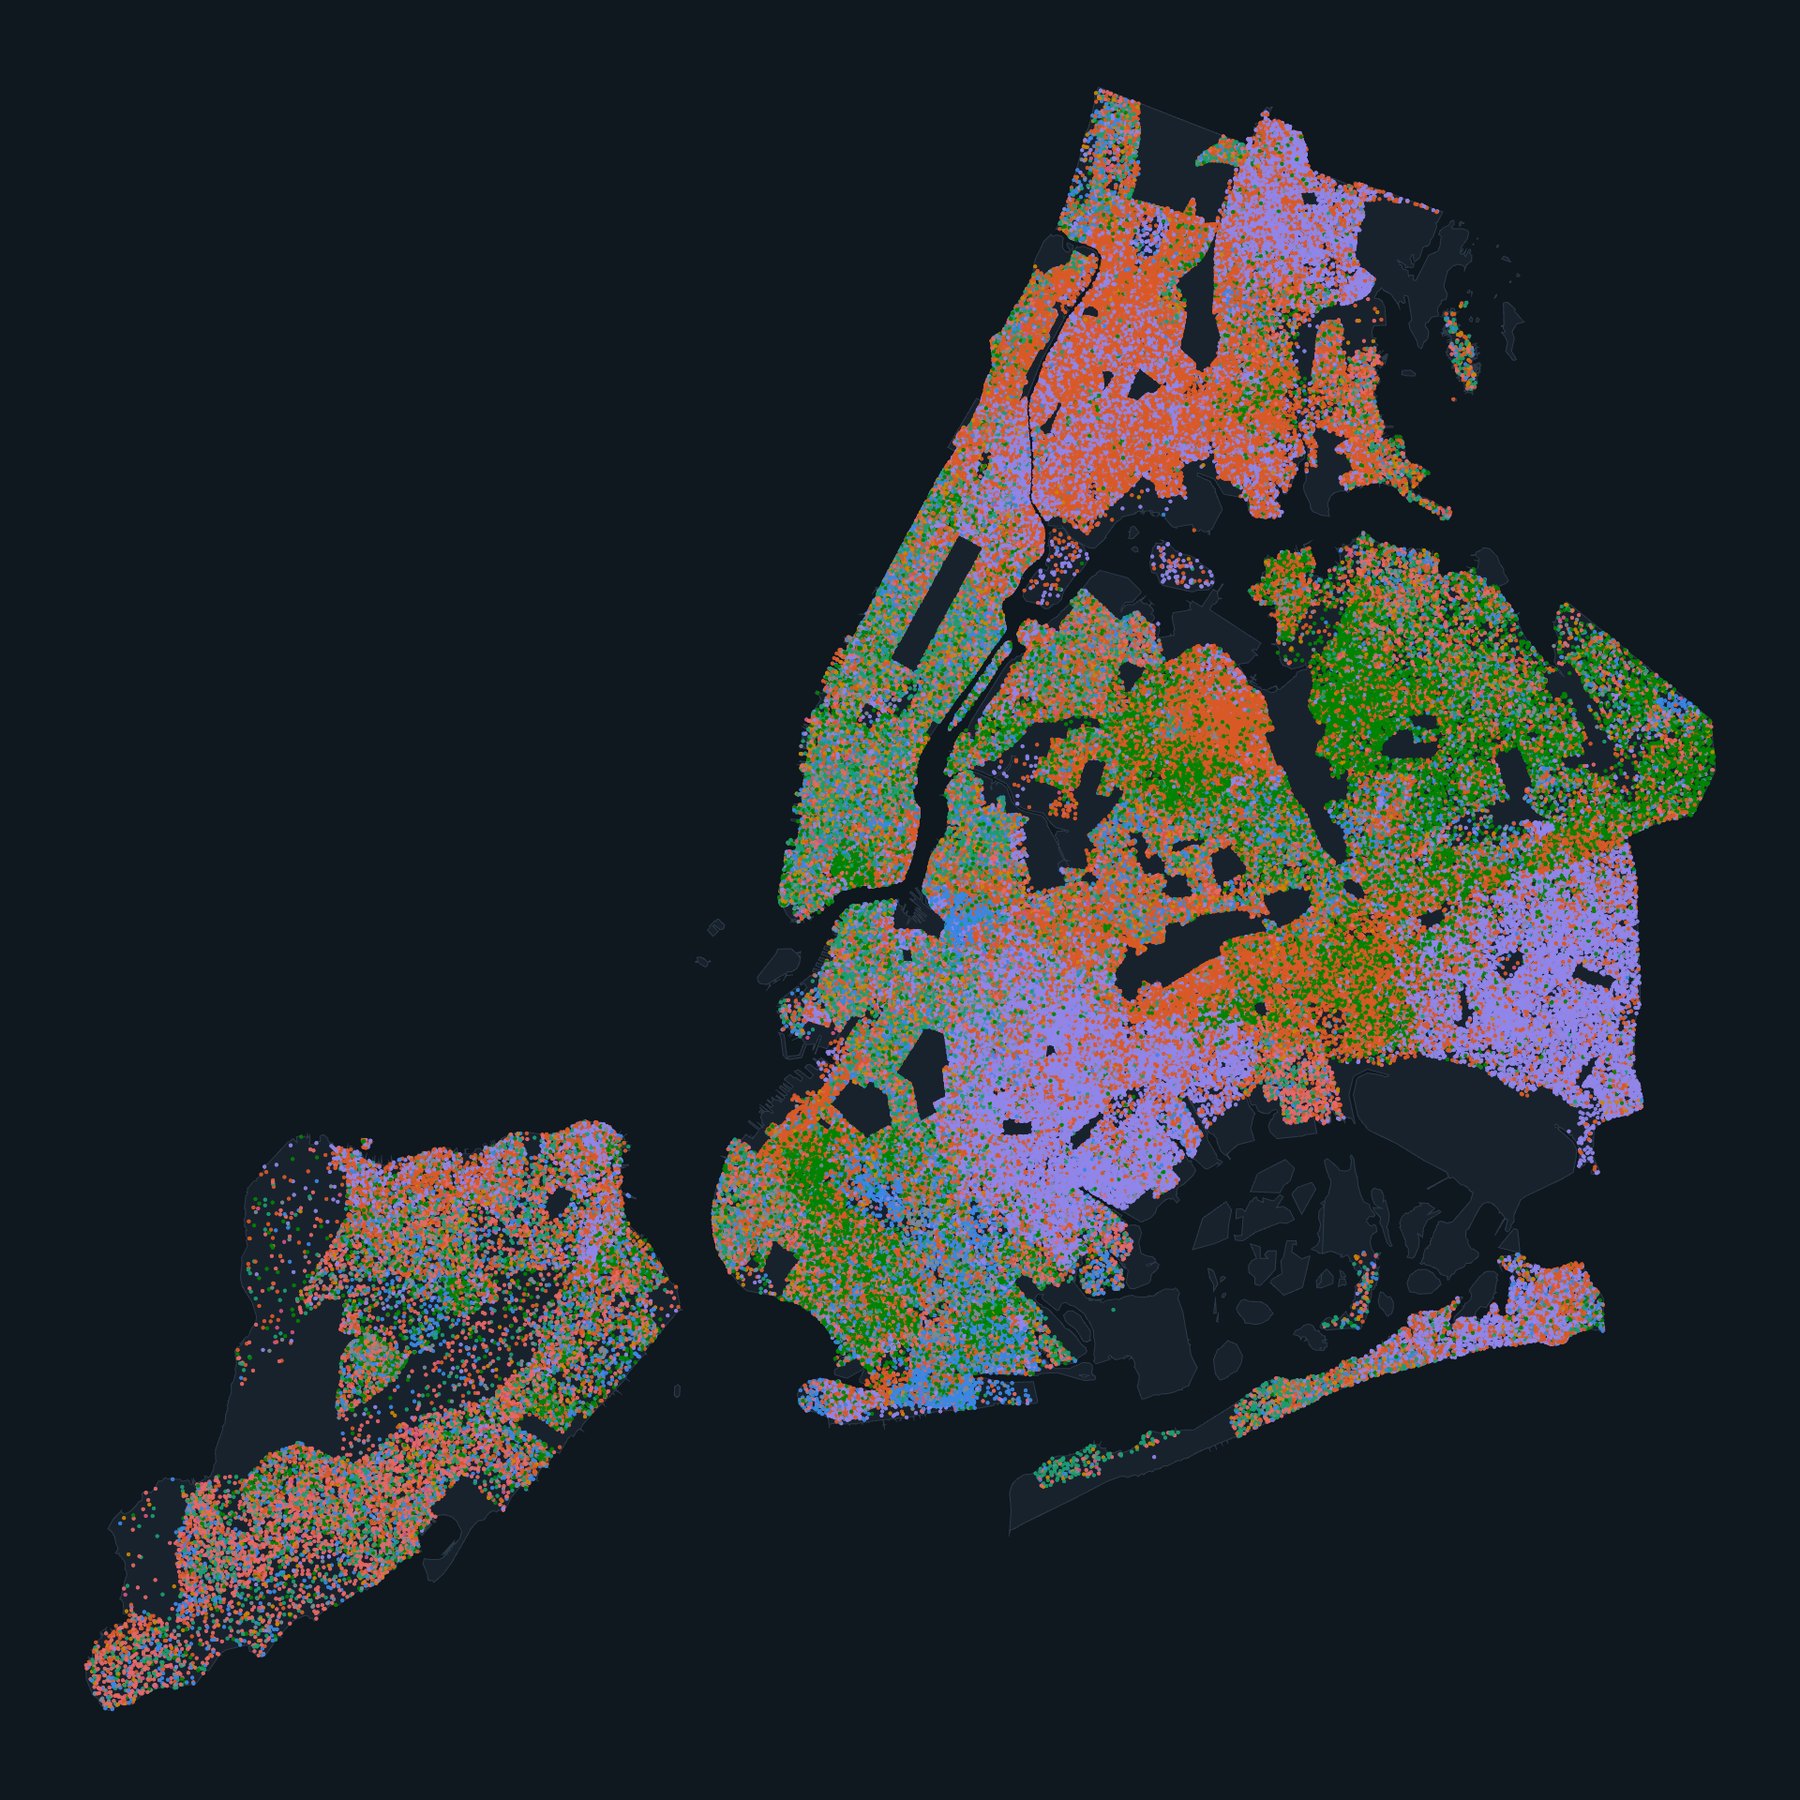
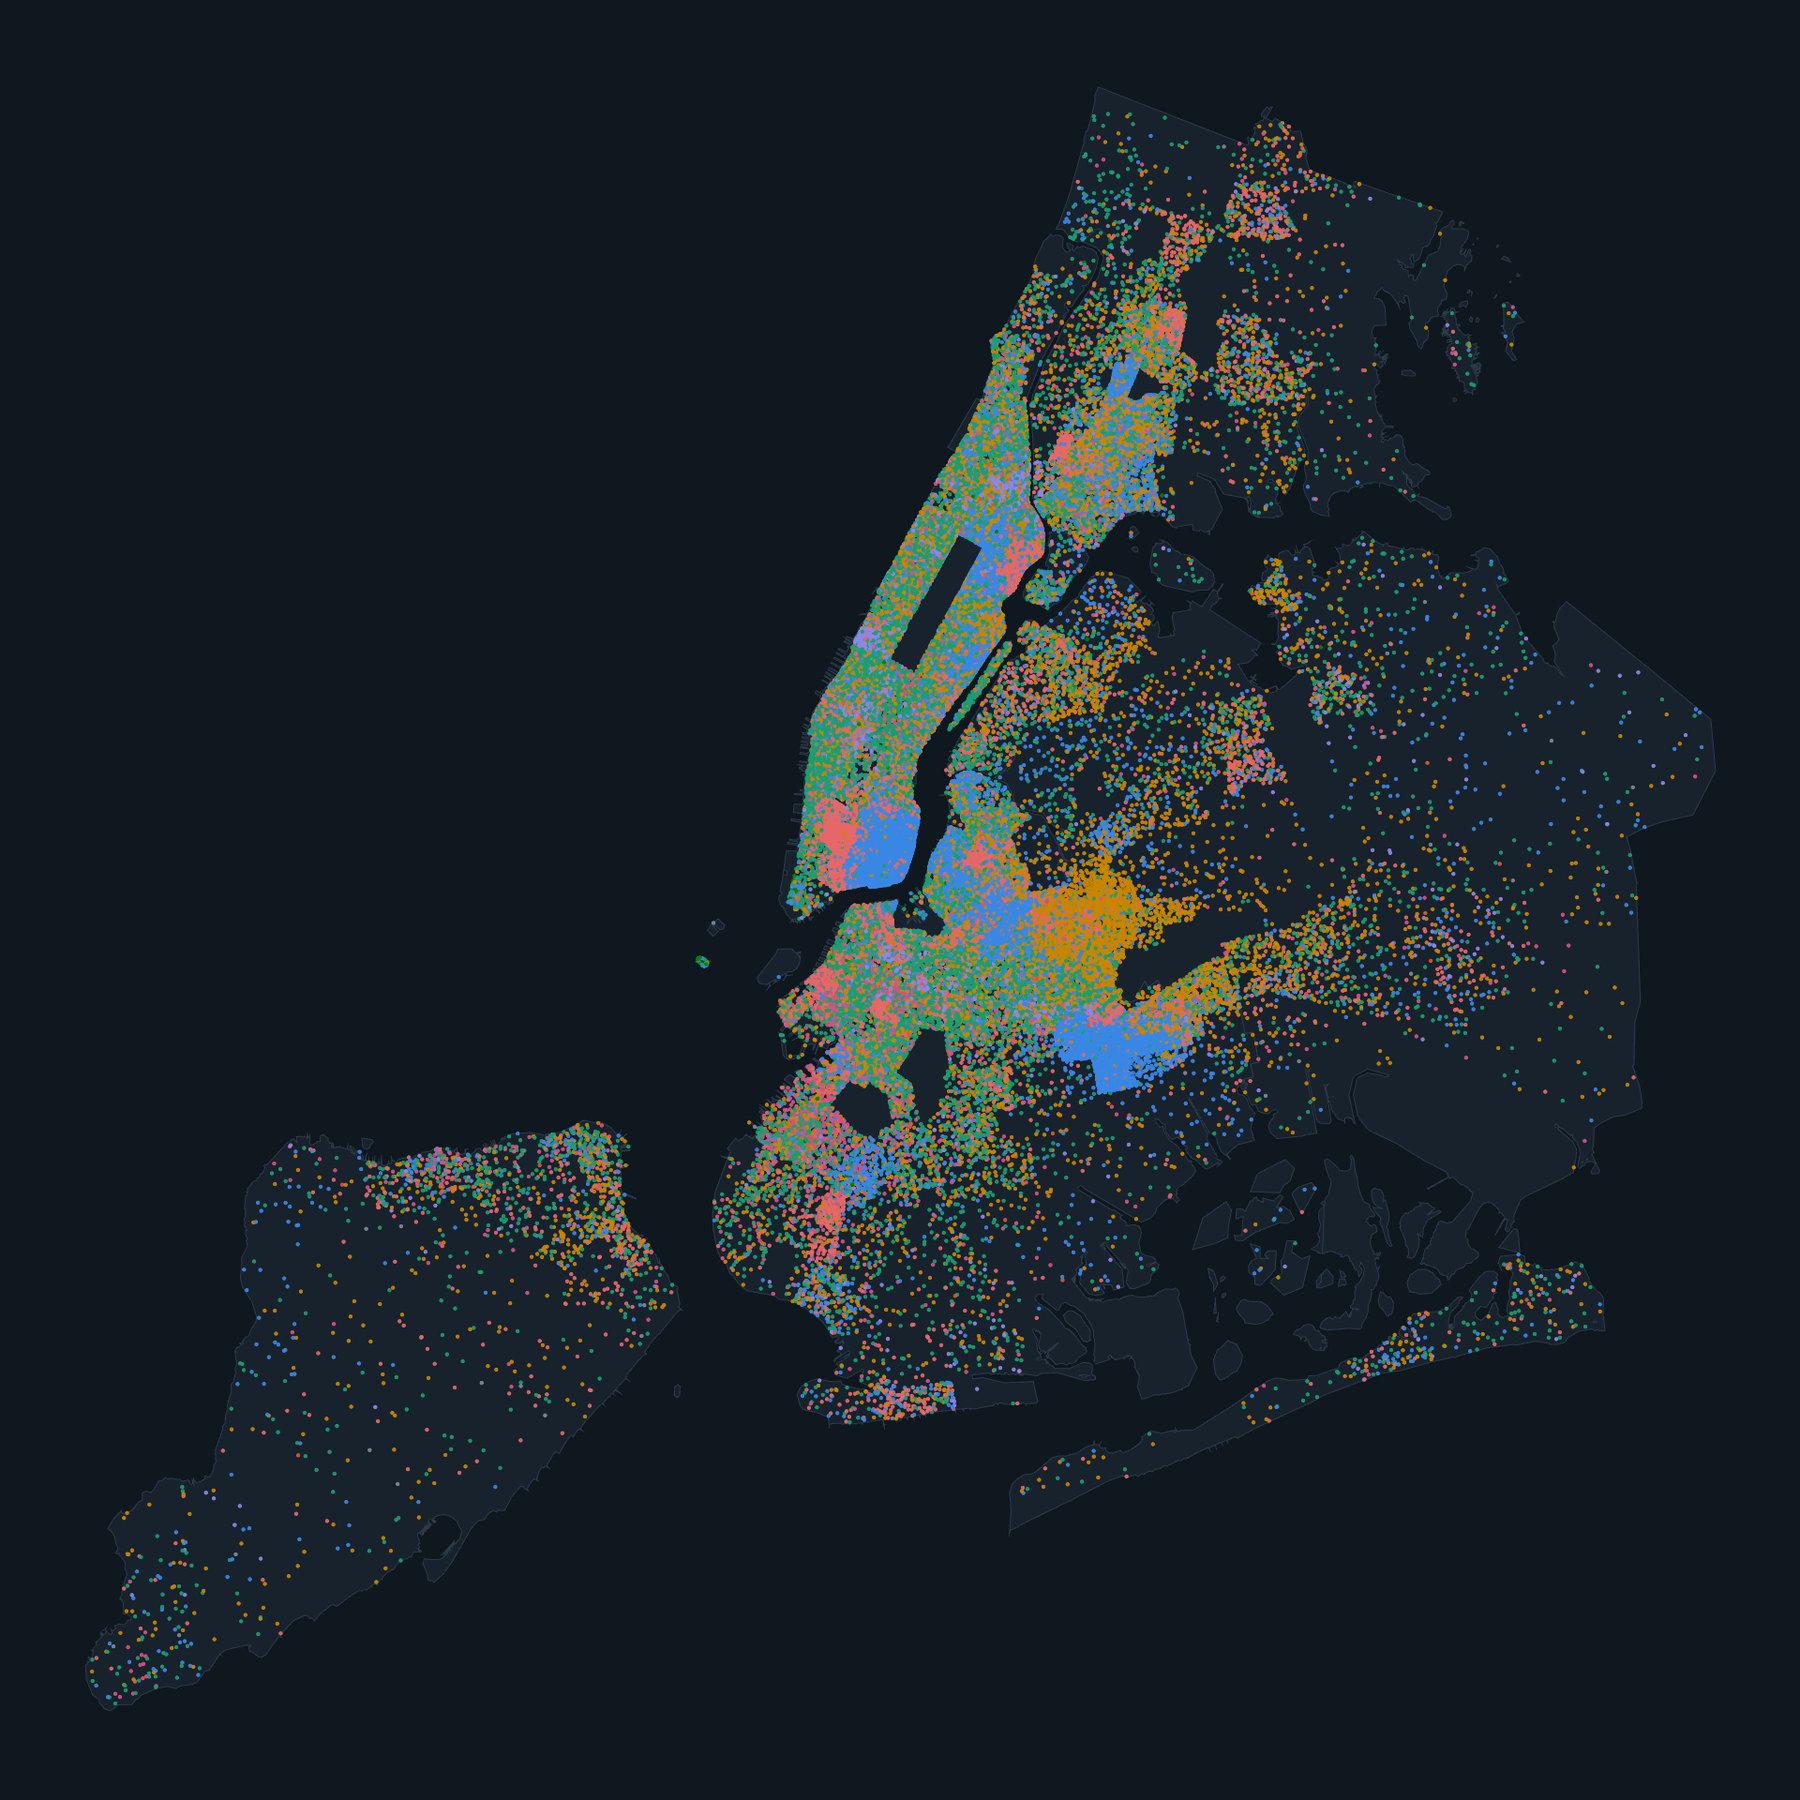
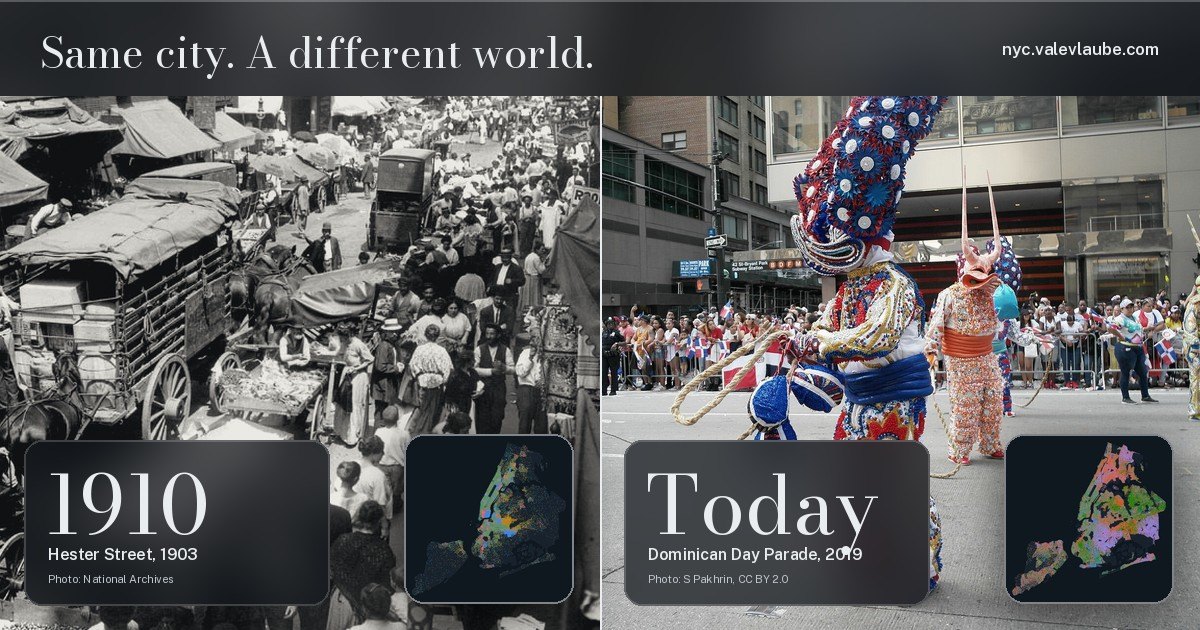
New York and Tallinn — Where New York Came From, launched at nyc.valevlaube.com, lets anyone watch a century of New York City immigration and migration unfold block by block. Built from historical census tract data, the map places one dot for every 25 New Yorkers in the neighborhood where they were counted and colors it by where their family came from: Italian, Irish, German, Russian and Eastern European, Nordic and Baltic, Puerto Rican, Caribbean and Latin American, Asian, African American and more.
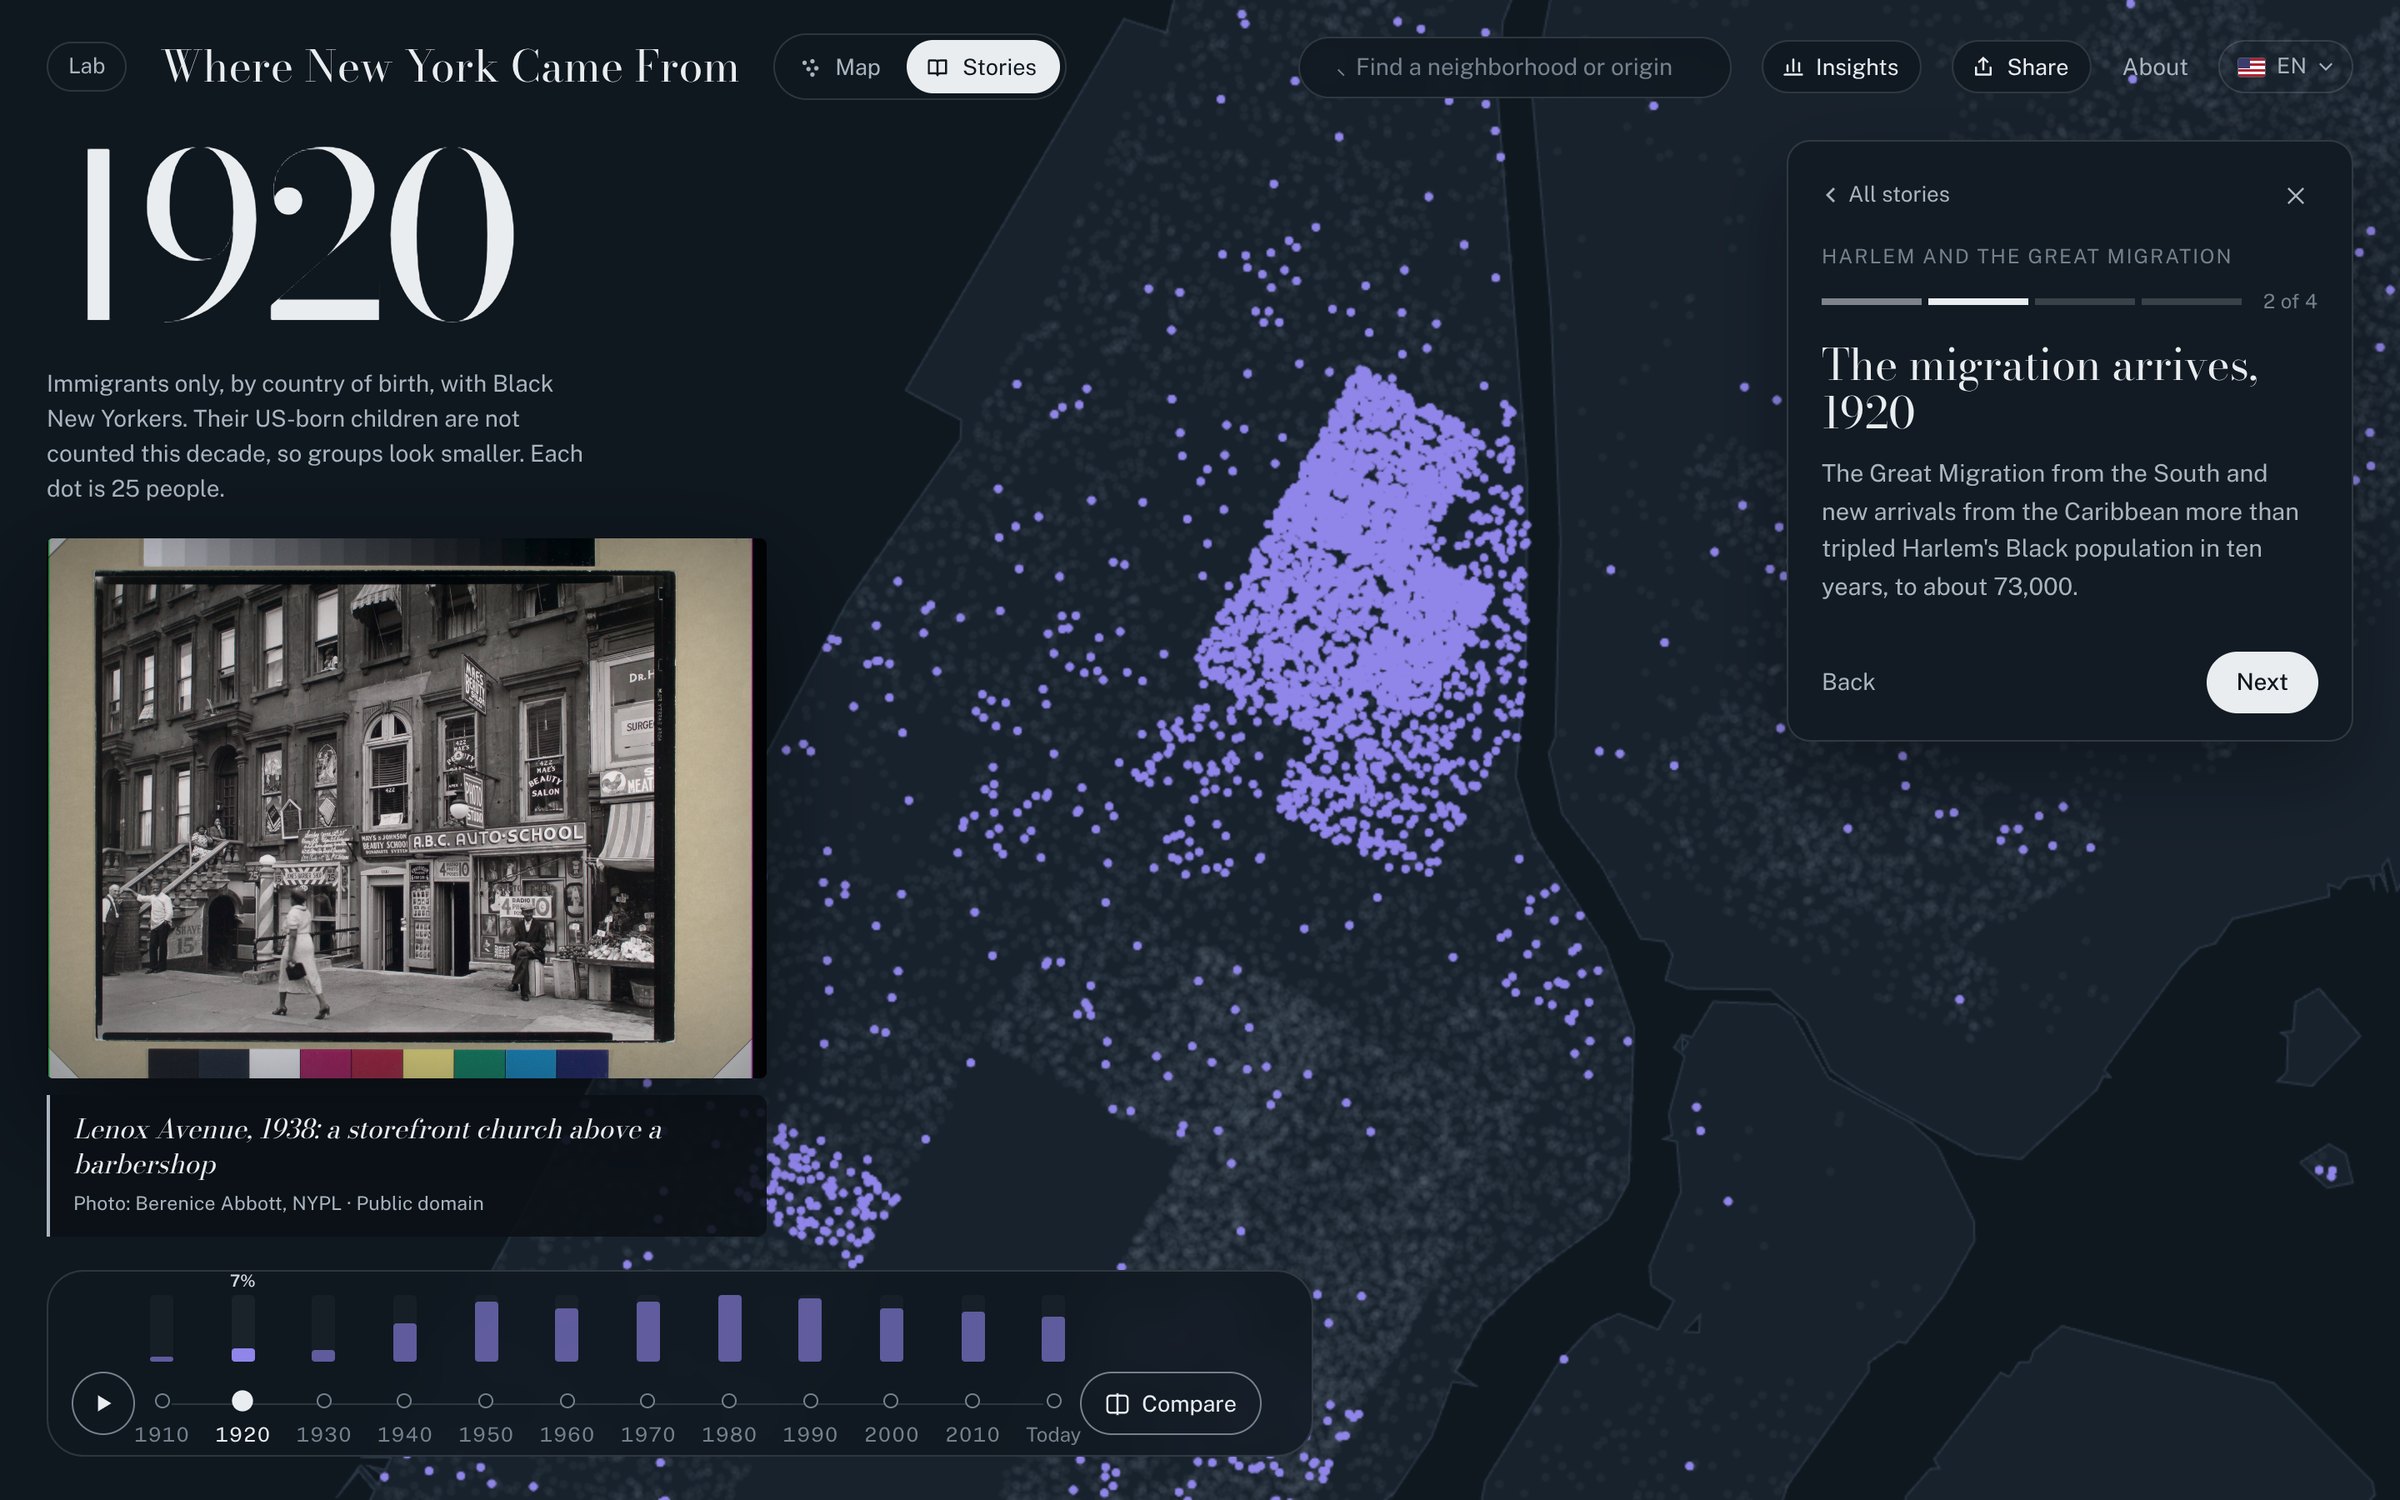
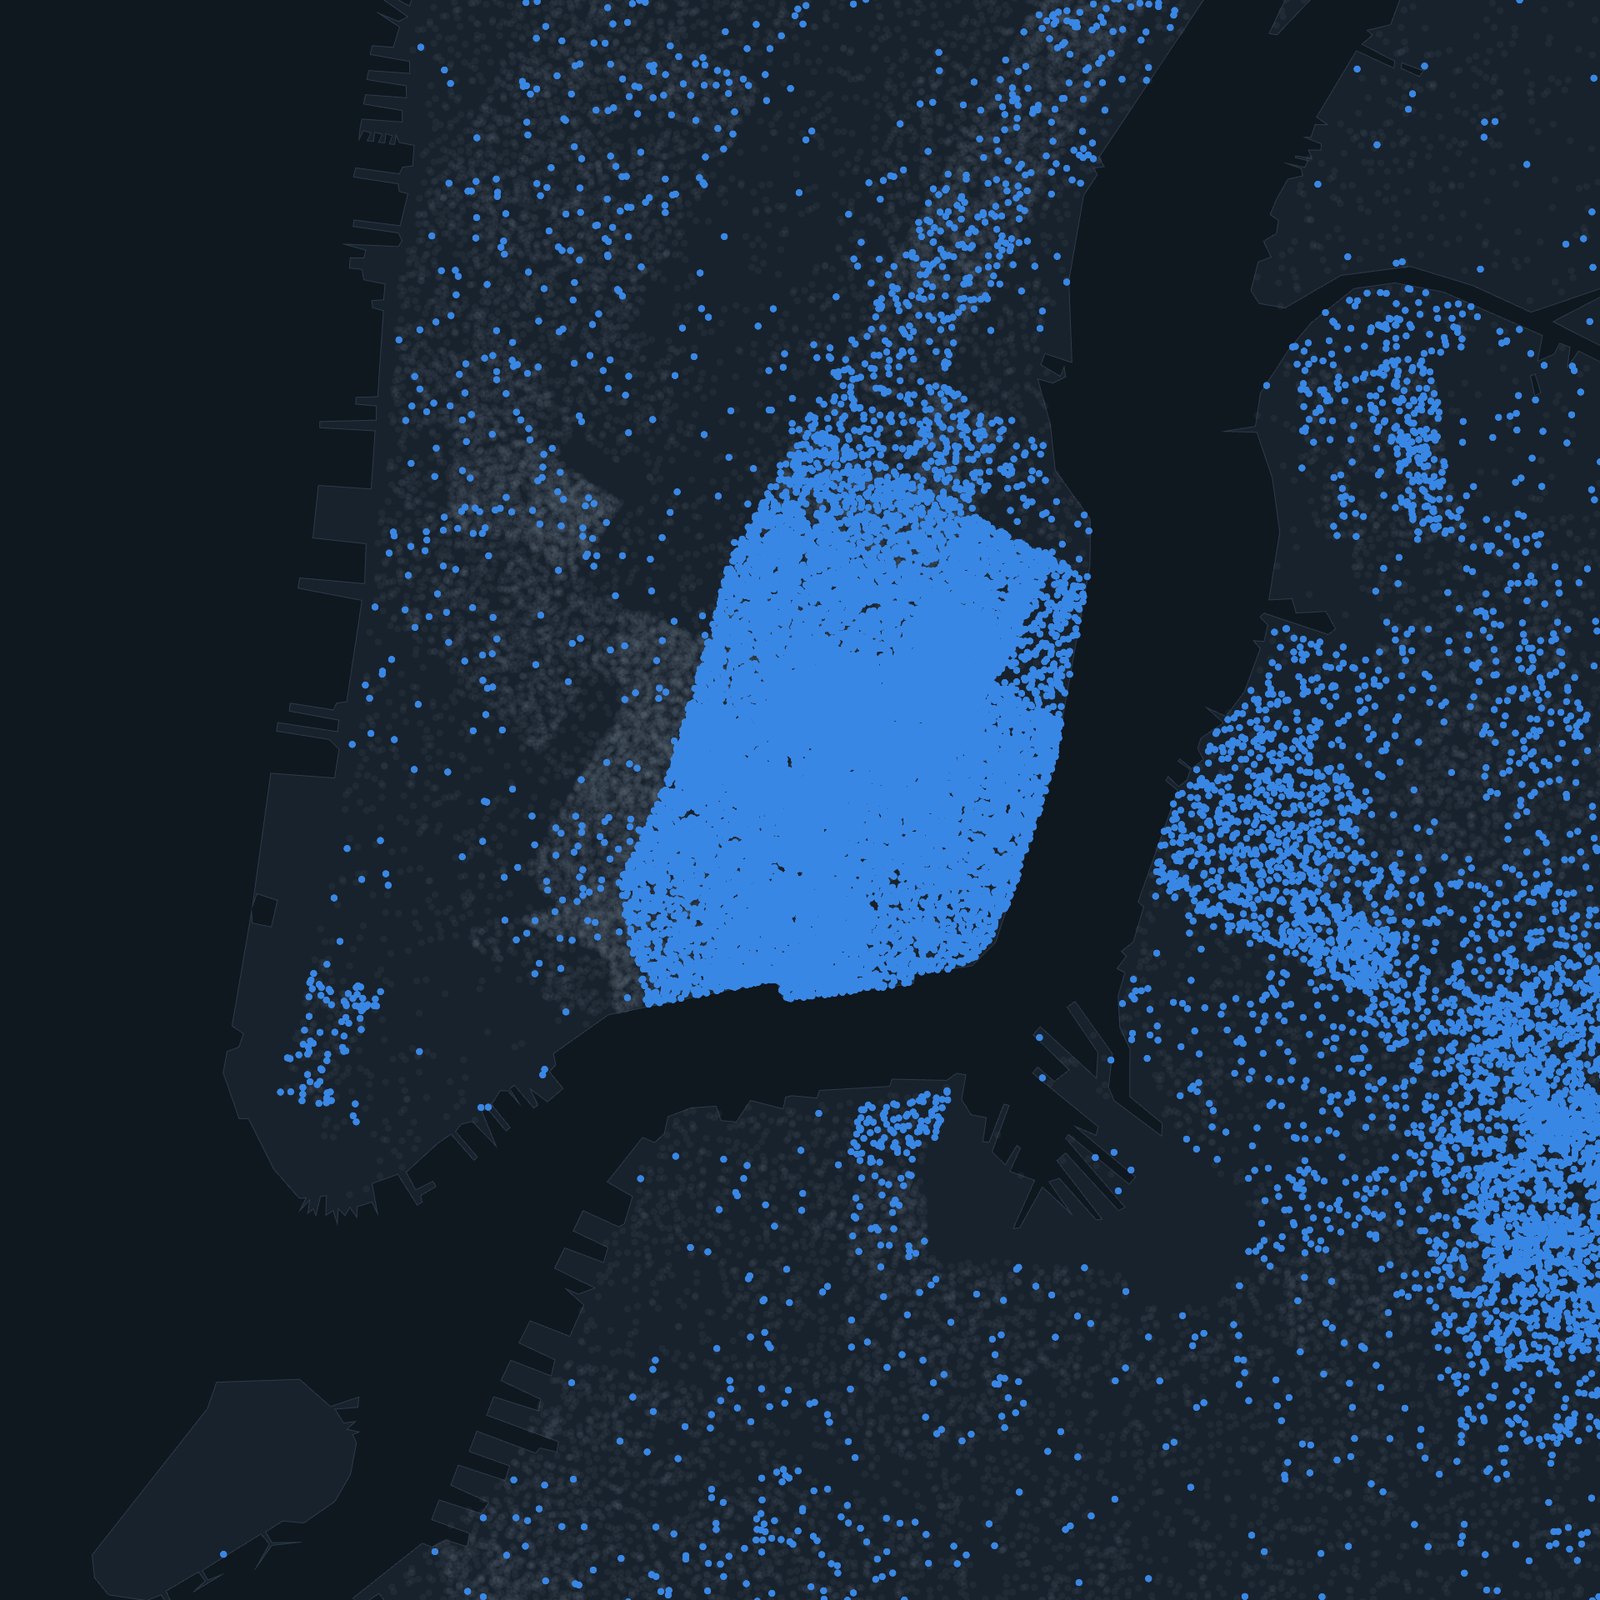
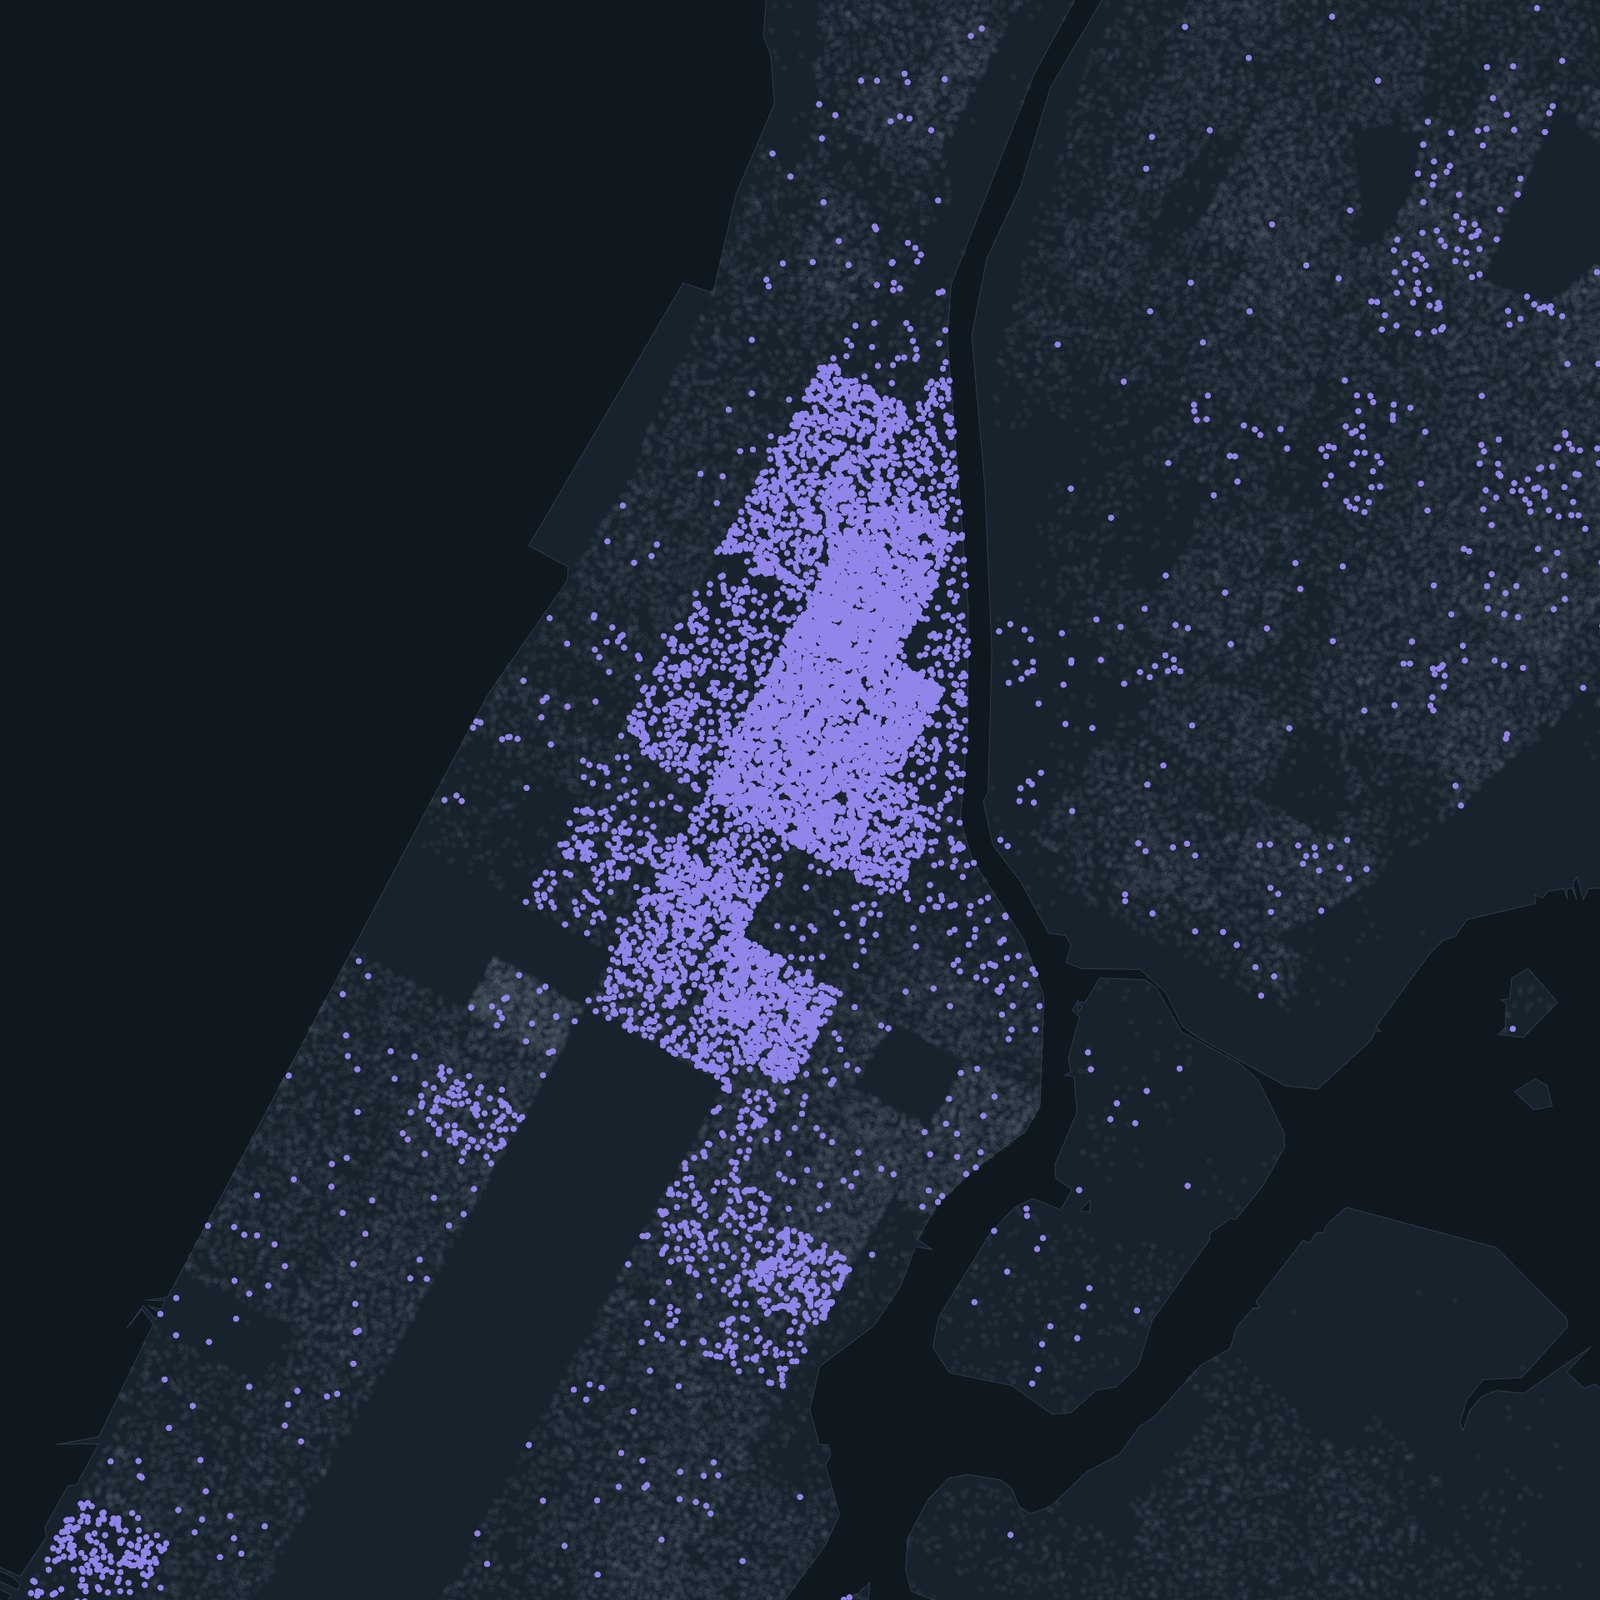
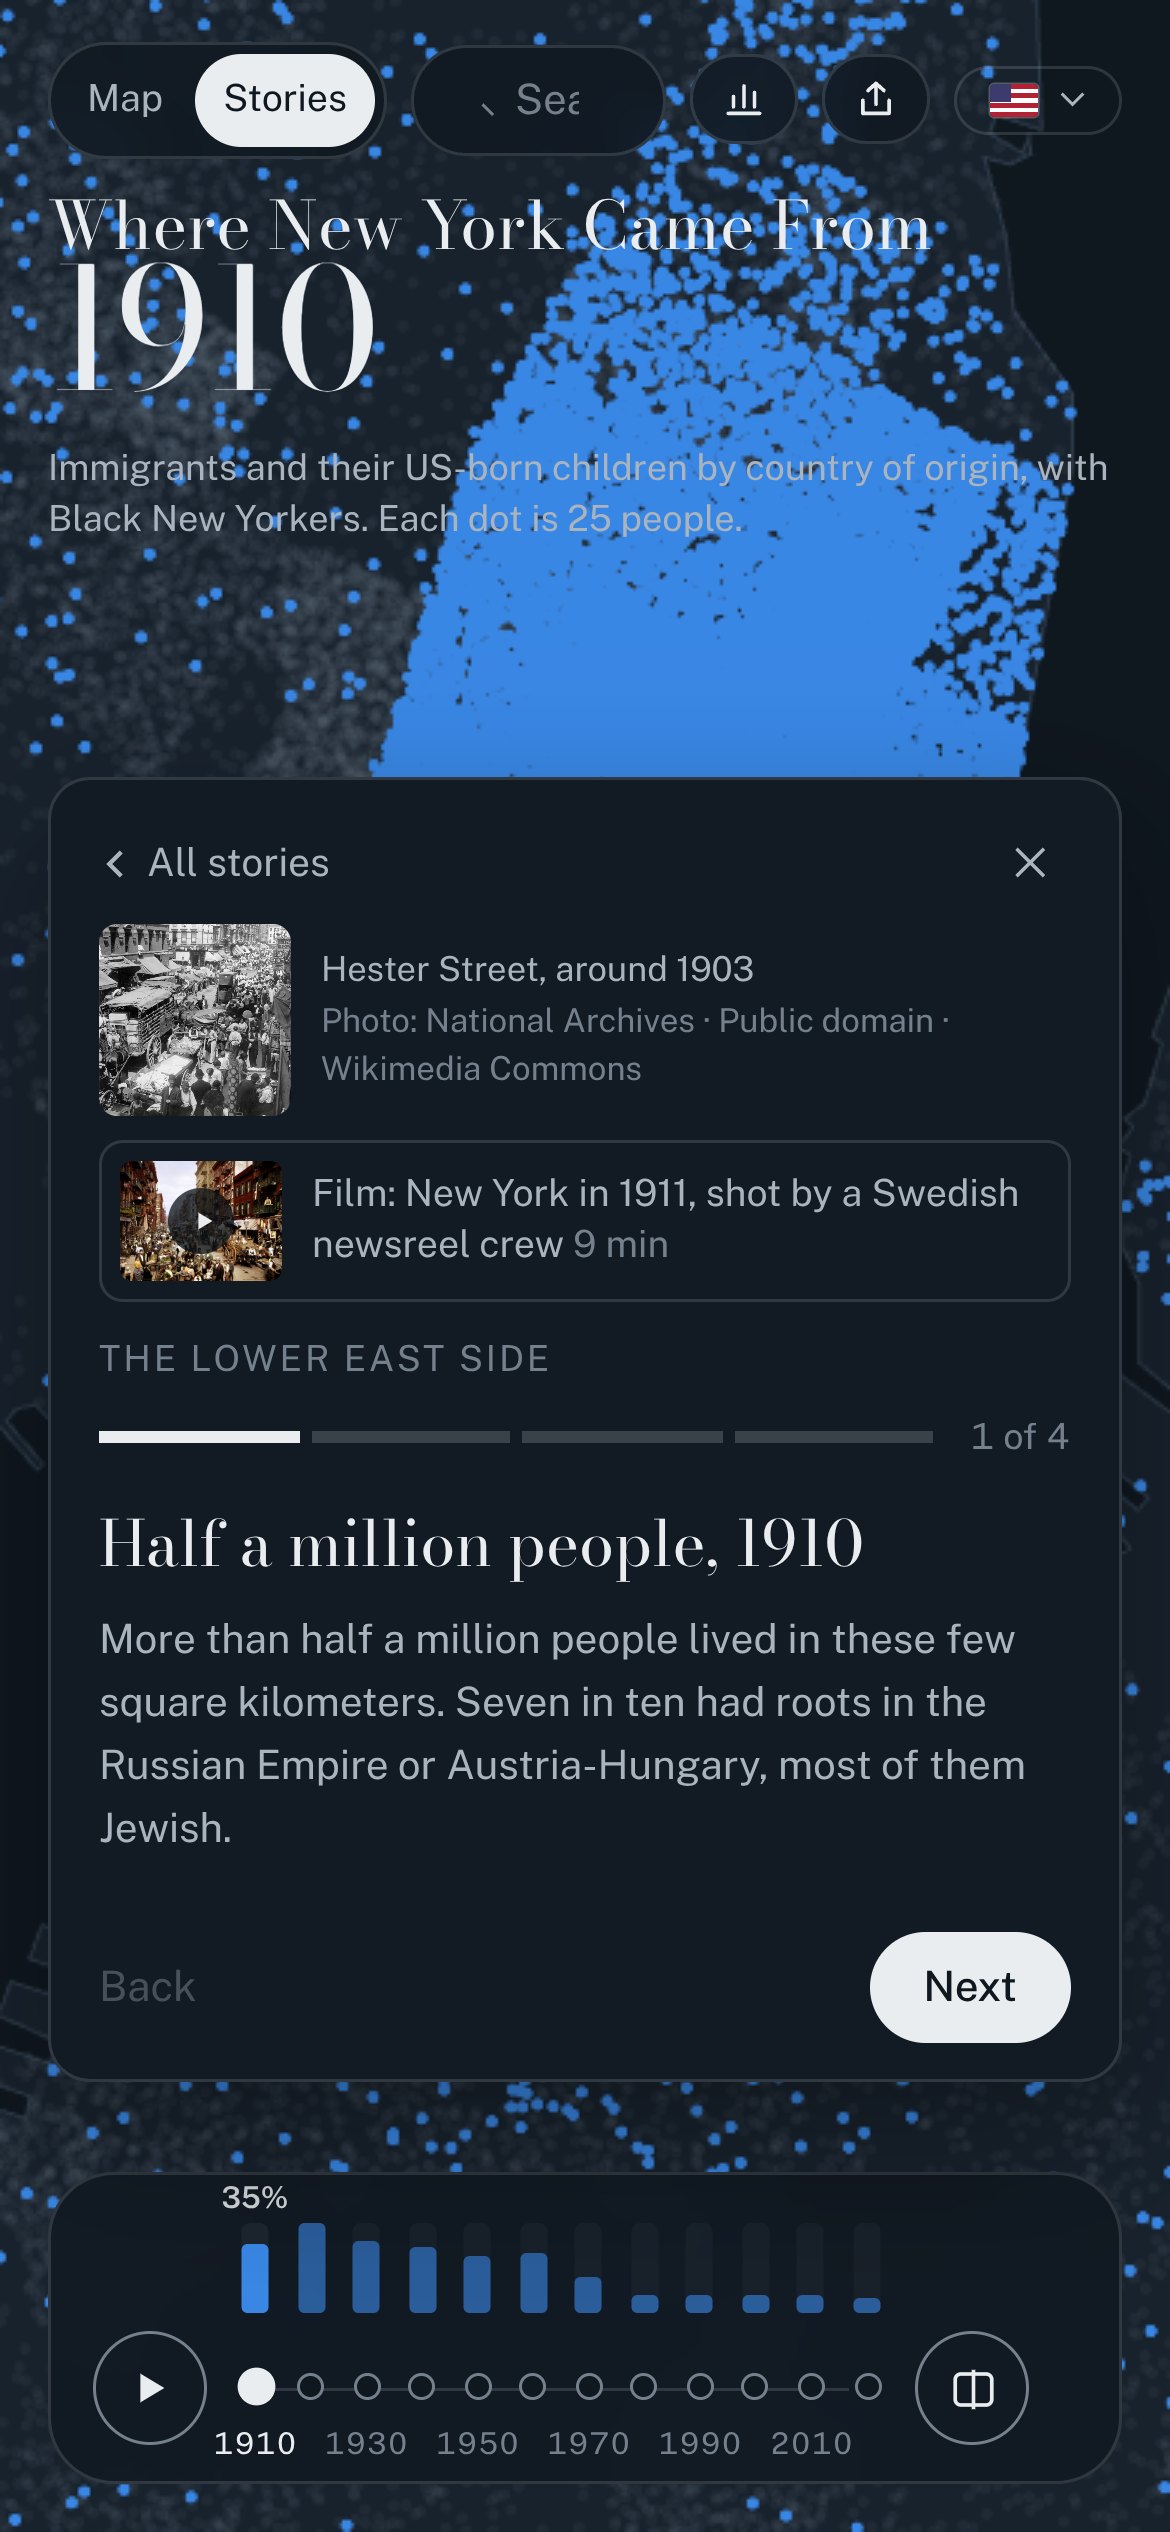
Drag the timeline and the city rearranges itself. The Lower East Side of 1910 holds half a million people in a few square kilometers. Harlem becomes the capital of Black America within twenty years. Italian Harlem turns into El Barrio, Little Norway gives way to Brooklyn's Chinatown, and Flushing becomes one of the largest Chinatowns in the country. Visitors can pick a single ancestry, from Norwegian to Dominican to Estonian, and follow it across the decades, or search any neighborhood for its own century in one chart.
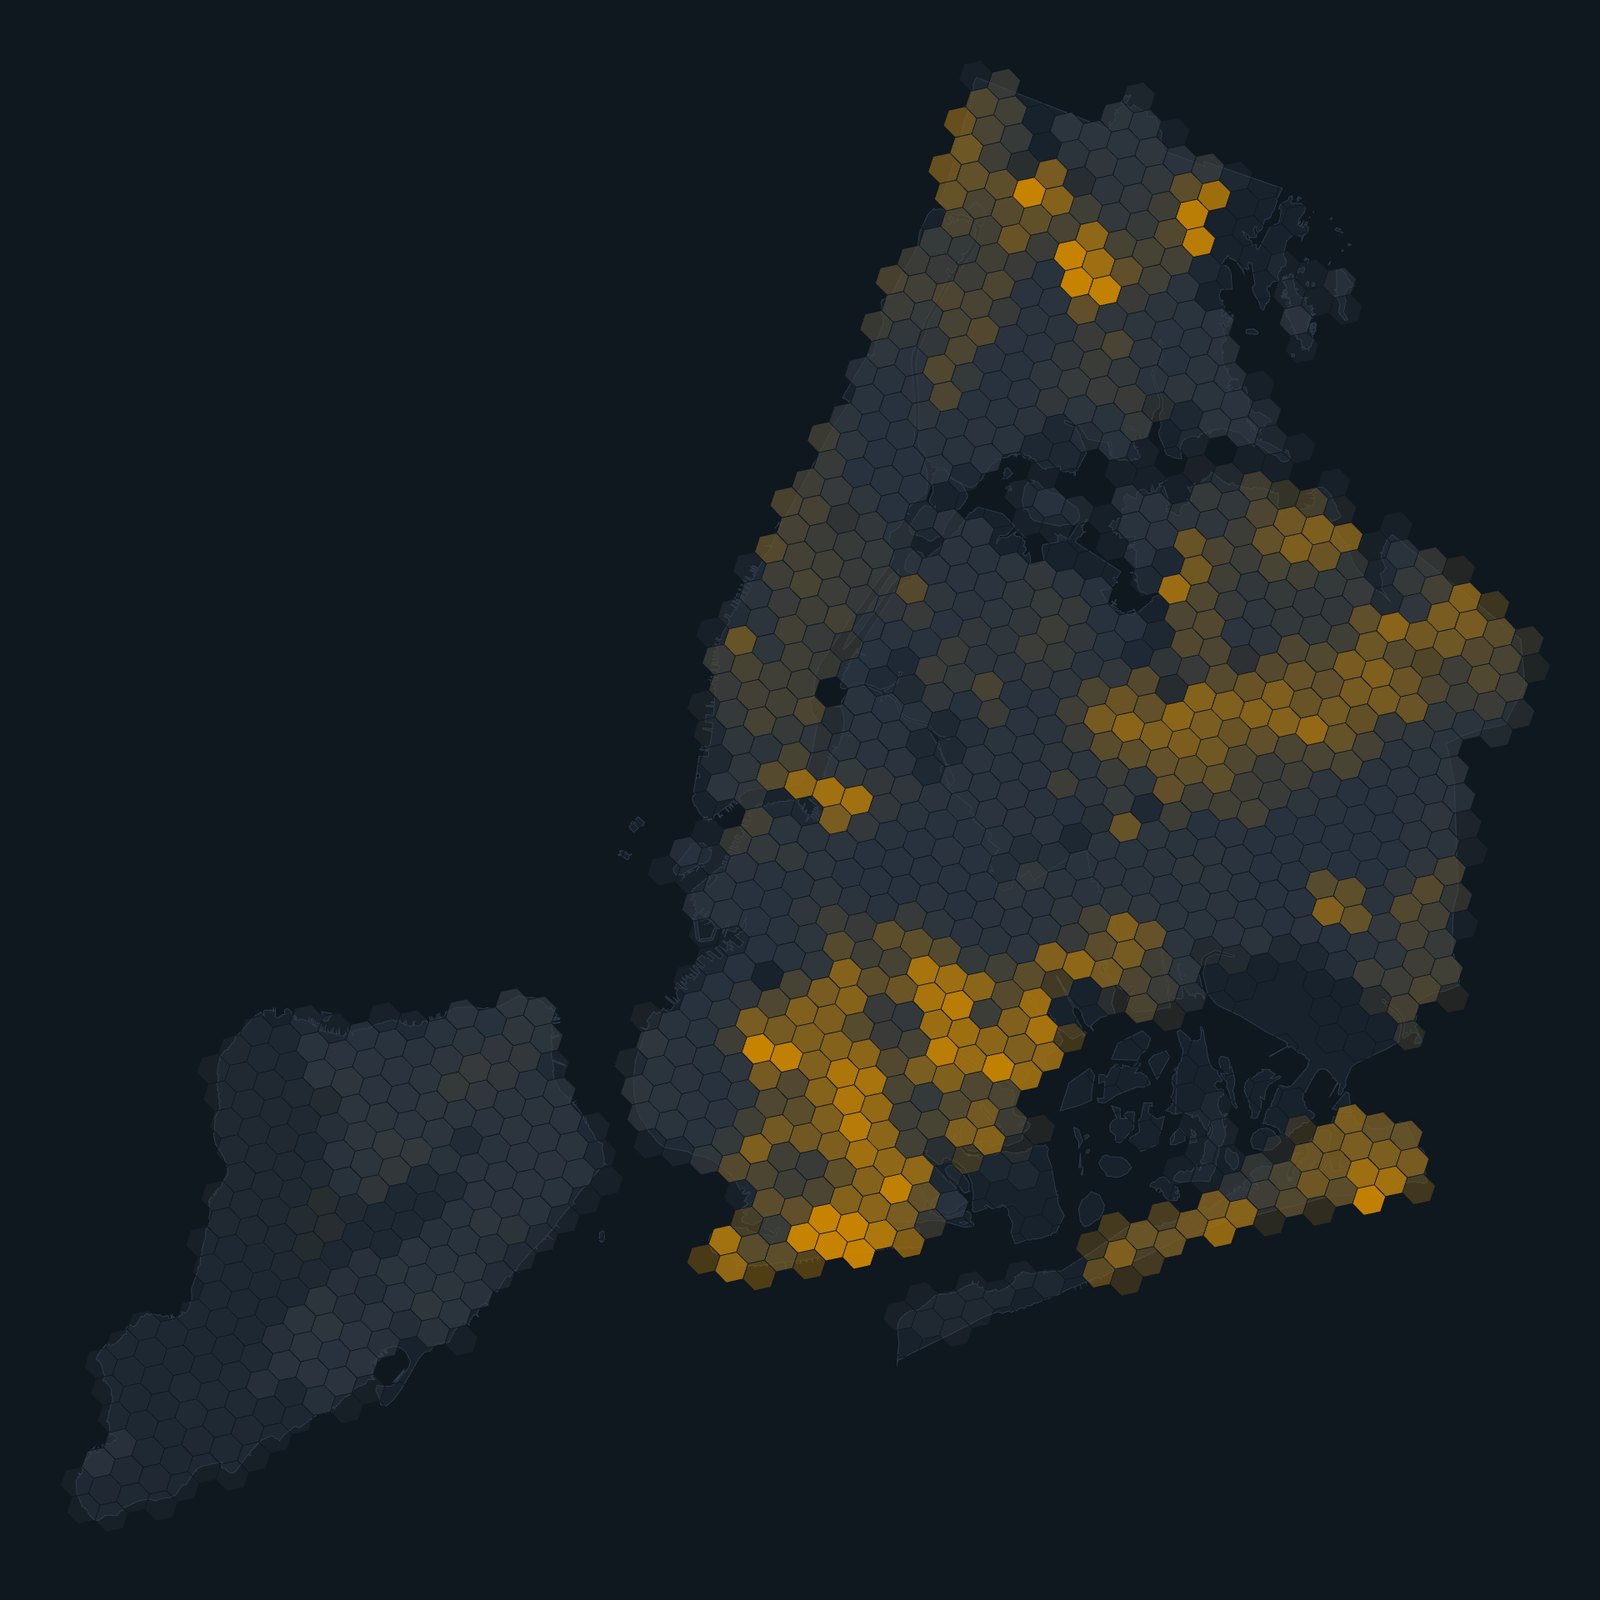
Beyond origins, the map shows how crowded the city was, who was born abroad, which languages were spoken at home (including the Yiddish map of 1970), what families paid in rent and earned, who owned their home, and the federal "redlining" maps of 1938, whose grades still line up with homeownership today. Ten guided stories, illustrated with archive photographs from the Library of Congress, the New York Public Library and the National Archives, walk through Harlem, the Lower East Side, Jewish New York, El Barrio, Little Odessa, the three Chinatowns, Brooklyn's Nordic waterfront, and the city's Finnish, Lithuanian and Estonian communities.
"New York is usually told as a story of famous neighborhoods, but the census lets you see every block, every decade," said Valev Laube, who built the project. "I came to the United States as an immigrant myself and made New York my home. I wanted something where anyone can find the street their grandparents arrived on and watch who came after them."
The map is free, has no advertising and works in English and Estonian on desktop and mobile. It is based on census data from IPUMS NHGIS at the University of Minnesota and on Mapping Inequality from the University of Richmond.
About Valev Laube. Valev Laube is a designer and technologist based between New York and Tallinn, founder of The VL Studios and editor of The Northern Voices, a publication about Nordic and Baltic communities in North America. Where New York Came From is part of his Lab series of free interactive projects at valevlaube.com/lab.
Contact: Valev Laube · [email protected] · valevlaube.com
The stories
- A century in seven stops — the quick tour, from the Lower East Side to Bensonhurst
- The Lower East Side — half a million people in 1910
- Harlem and the Great Migration — how Harlem became the capital of Black America
- From Italian Harlem to El Barrio — one neighborhood, two great migrations
- Jewish New York — the Lower East Side, Brownsville and the Yiddish map
- New York's three Chinatowns — Manhattan, Flushing and Sunset Park
- Little Odessa — Brighton Beach from the 1930s to today
- Brooklyn's Nordic waterfront — Little Norway and what came after
- Finns, Lithuanians and Estonians — from Finntown to the Estonian House
- Redlining's long shadow — the 1938 maps and homeownership today
Images
Map images, screenshots and promo cards may be used freely in coverage of the project, credited "Valev Laube / Where New York Came From". Click an image for the full-size file. Archive photographs shown inside the screenshots keep their own credits, listed on the map.
About the data
Census tract data come from IPUMS NHGIS, University of Minnesota (Manson et al., IPUMS National Historical Geographic Information System, version 21.0, 2026), from 1910 to the 2020–2024 American Community Survey. Tract counts are aggregated to hexagons; dots are placed at random inside the tract where people were counted, never at real addresses. The Census Bureau asked about origins differently over the century, so each decade shows the closest measure it published for small areas, and the map says which. The 1938 redlining maps come from Mapping Inequality, University of Richmond. Full notes are under About on the map.
Contact
Valev Laube
Creator. Available for interviews online, in English and Estonian, and for written Q&A.
[email protected] · valevlaube.com
Partnerships
Museums, libraries, schools and community organizations are welcome to link, embed or build programs around the map. Custom views and stories for a specific community are possible.
Eesti keeles
Kust tuli New York on tasuta interaktiivne kaart, mis näitab New Yorgi iga linnaosa elanike päritolu aastast 1910 kuni tänaseni. Iga täpp tähistab 25 inimest ja on värvitud selle järgi, kust nende pere pärit on. Kaardil on kümme juhendatud lugu arhiivifotodega, sealhulgas lugu soome, leedu ja eesti kogukondadest ning New Yorgi Eesti Majast. Autor on Valev Laube, kes elas aastaid New Yorgis. Kaart on eesti ja inglise keeles: nyc.valevlaube.com/?lang=et